This visualization shows developers' collaboration graphs on GitHub.
Users that contribute to multiple projects represent a link among different communities of developers. Those users can occupy structural holes between different communities in the network, becoming Structural Hole (SH) spanners.
Both graphs 1 and 2 are developer-developer networks where nodes represent users and edges represent repositories in which the users they connect both contribute.
Graph 1 only contains users that appear in more than one project.
Graph 2 represents the general network.
Nodes: 404
Edges: 6214
Diameter: 6
Assortativity: 0.394653
The network only contains users that appear in more than one project, to isolate more clearly a knowledge-spreading network.
This means that this network is a subset of graph 2.
Nodes: 404
Edges: 6214
Diameter: 6
Assortativity: 0.394653
The network only contains users that appear in more than one project, to isolate more clearly a knowledge-spreading network.
This means that this network is a subset of graph 2.
Structural Hole spanners detection is performed using Burt’s constraint measure. The constraint coefficient uses the degree of dependence of nodes on the other nodes as the evaluation criteria. The greater the value, the stronger the constraint, the stronger the dependence, and the lower the ability to cross the structural hole. SH spanners will likely have a lower constraint value.
Red means a lower constraint, while blue is higher
Nodes: 8290
Edges: 419401
Diameter: 7
Assortativity: 0.051746
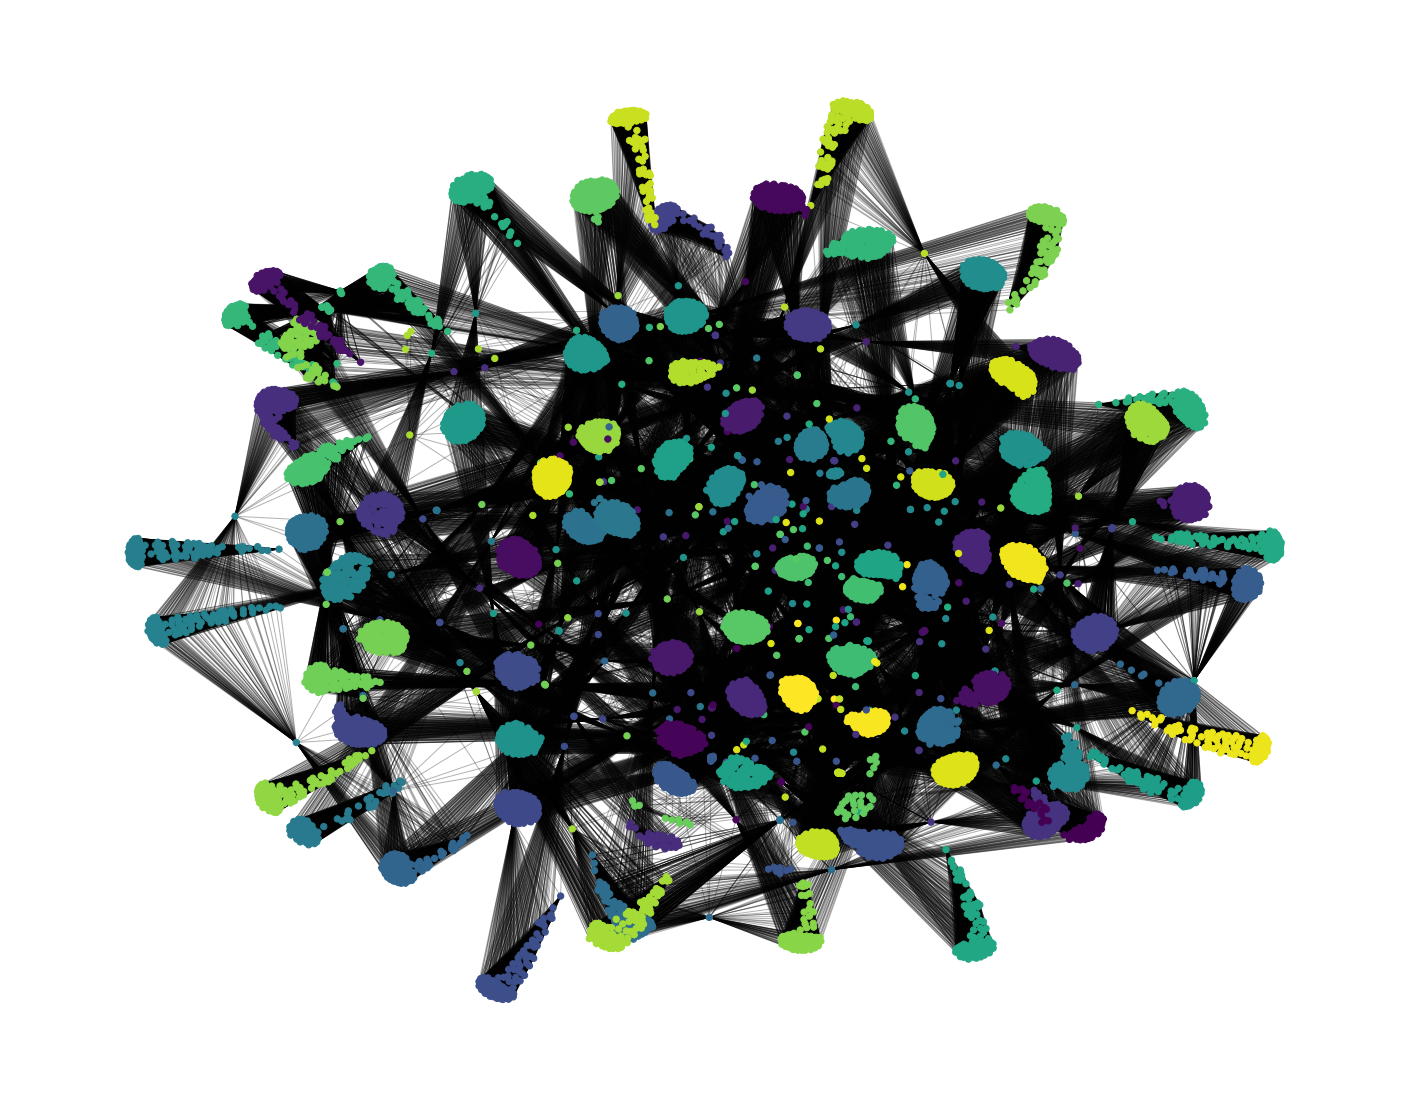
This is the general network, where every user in the dataset is present as a node, which allows for a wide-ranging overview.
The node positions are obtained through the Fruchterman-Reingold graph drawing algorithm, explained later.
Nodes: 8290
Edges: 419401
Diameter: 7
Assortativity: 0.051746
Detected communities: 95
This is the general network, where every user in the dataset is present as a node, which allows for a wide-ranging overview.
Community detection is performed on the network using the Louvain method: multiple iteration heuristic that starts from an initial state of considering every node as a single community and iteratively improving the quality of community assignment until the gain in modularity becomes negligible.
The network shows the 95 communities found by the first pass of the Louvain method. Those communities numerically coincide exactly with the repositories (= 95). Every detected community in the graph is assigned a different shade of color.
Nodes: 8290
Edges: 419401
Diameter: 7
Assortativity: 0.051746
SH spanners are identified with the 350 most important users according to the PageRank metric.
PageRank gives an “importance score” to nodes by counting the number of links to a node and their respective PageRank importance iteratively, until it reaches convergence.
SH spanners are highlighted in yellow.
Nodes highlighted as SH spanners according to PageRank ≈ Nodes that were positioned in-between communities by the force-directed graph drawing algorithm